
Joining the team. Evaluating site performance.
First, I needed to take a look at the historic data. Nominal daily traffic to the site averaged from 375 to 450 visitors with traffic initially spiking up to 3500 per day with campaign launches combined with ad referrals — campaigns occurred monthly, many centered around major holidays.
In all, the website was only converting 2-6 visitors a month into Hum owners. Meanwhile, the device was selling around 125 devices per month (abysmal, but more on that later).


Traffic, even during campaign periods, was far from impressive, suggesting that product awareness (and value) was fairly poor. After all, even in 2017, Apple CarPlay and Android Auto were delivering connected car systems that did everything Hum could do, and, at no extra cost beyond owning a phone and compatible car.
While the market space for Hum was somewhat limited, the device was somehow making its way into customer’s hands as a consistent pace.
The most baffling figure was that online sales were accounting for only 1-6% of monthly sales. Why?!!
What was causing low conversion on-site?
Digging deeper into site data — in order to understand why the site was not converting — revealed a troubling churn.
Users were spending a great deal of time traversing the product listing and product detail pages, with very few making it out of the cycle to create a shopping cart, let alone complete a purchase.

The site was essentially failing mid-funnel, and failing hard! While campaign efforts were building some interest and intrigue in the product, potential customers were coming to the site to learn exactly what Hum was.
Navigation patterns going back and forth between the product listings and product detail pages strongly suggested that the site was failing to educate users and further failing to compel users to purchase, only 3% of total traffic that made it to a product detail page added to cart.
Users were just not compelled by the site to consider Hum as a worthwhile product.
The site left customer’s confused
Churn between the listing and detail pages + high abandonment rates (on those pages) suggested that customers were not getting the information they needed to make a confident purchase decision.
Content in chaos
The site also failed to properly organize features and price points for Hum, amplifying the confusion customers faced as they were hunting for relevant information on the product listing and product detail pages.
Blindness to revisits
Data showed that only 3% of customers entered the cart/checkout flow, BUT, that there was a 22% return visitor rate.
The site, however, was not architected to take advantage of those return visitors’ needs.
The solution? Clarifying product and the journey across the funnel.
The site had essentially been organized and designed without proper UX input. Pages were essentially crafted in silos, with little consideration given to customers who would be arriving knowing next to nothing about Hum or connected car devices.
If they didn’t know what Hum could do for them, there was no way they could confidently make a decision to purpose.
At this point, I was ready to diagnose and propose:
Foster an education journey
The site needed to instill confidence in Hum’s product purpose as well as the product cost (inclusive of the monthly data subscription).
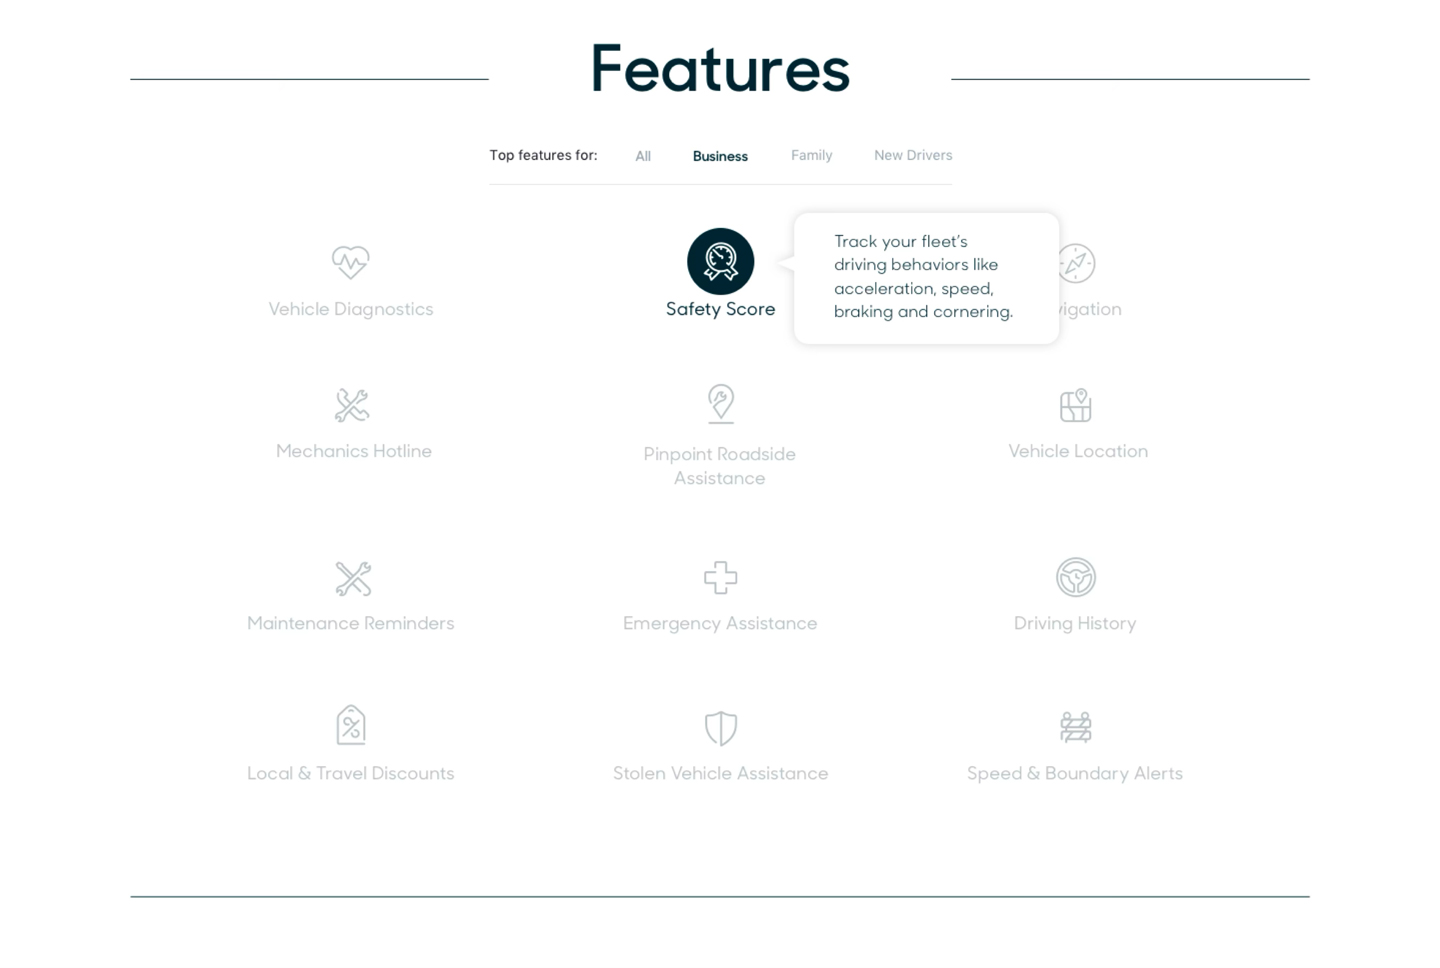
I proposed that we needed to add product and feature pages that highlighted Hum’s use cases.
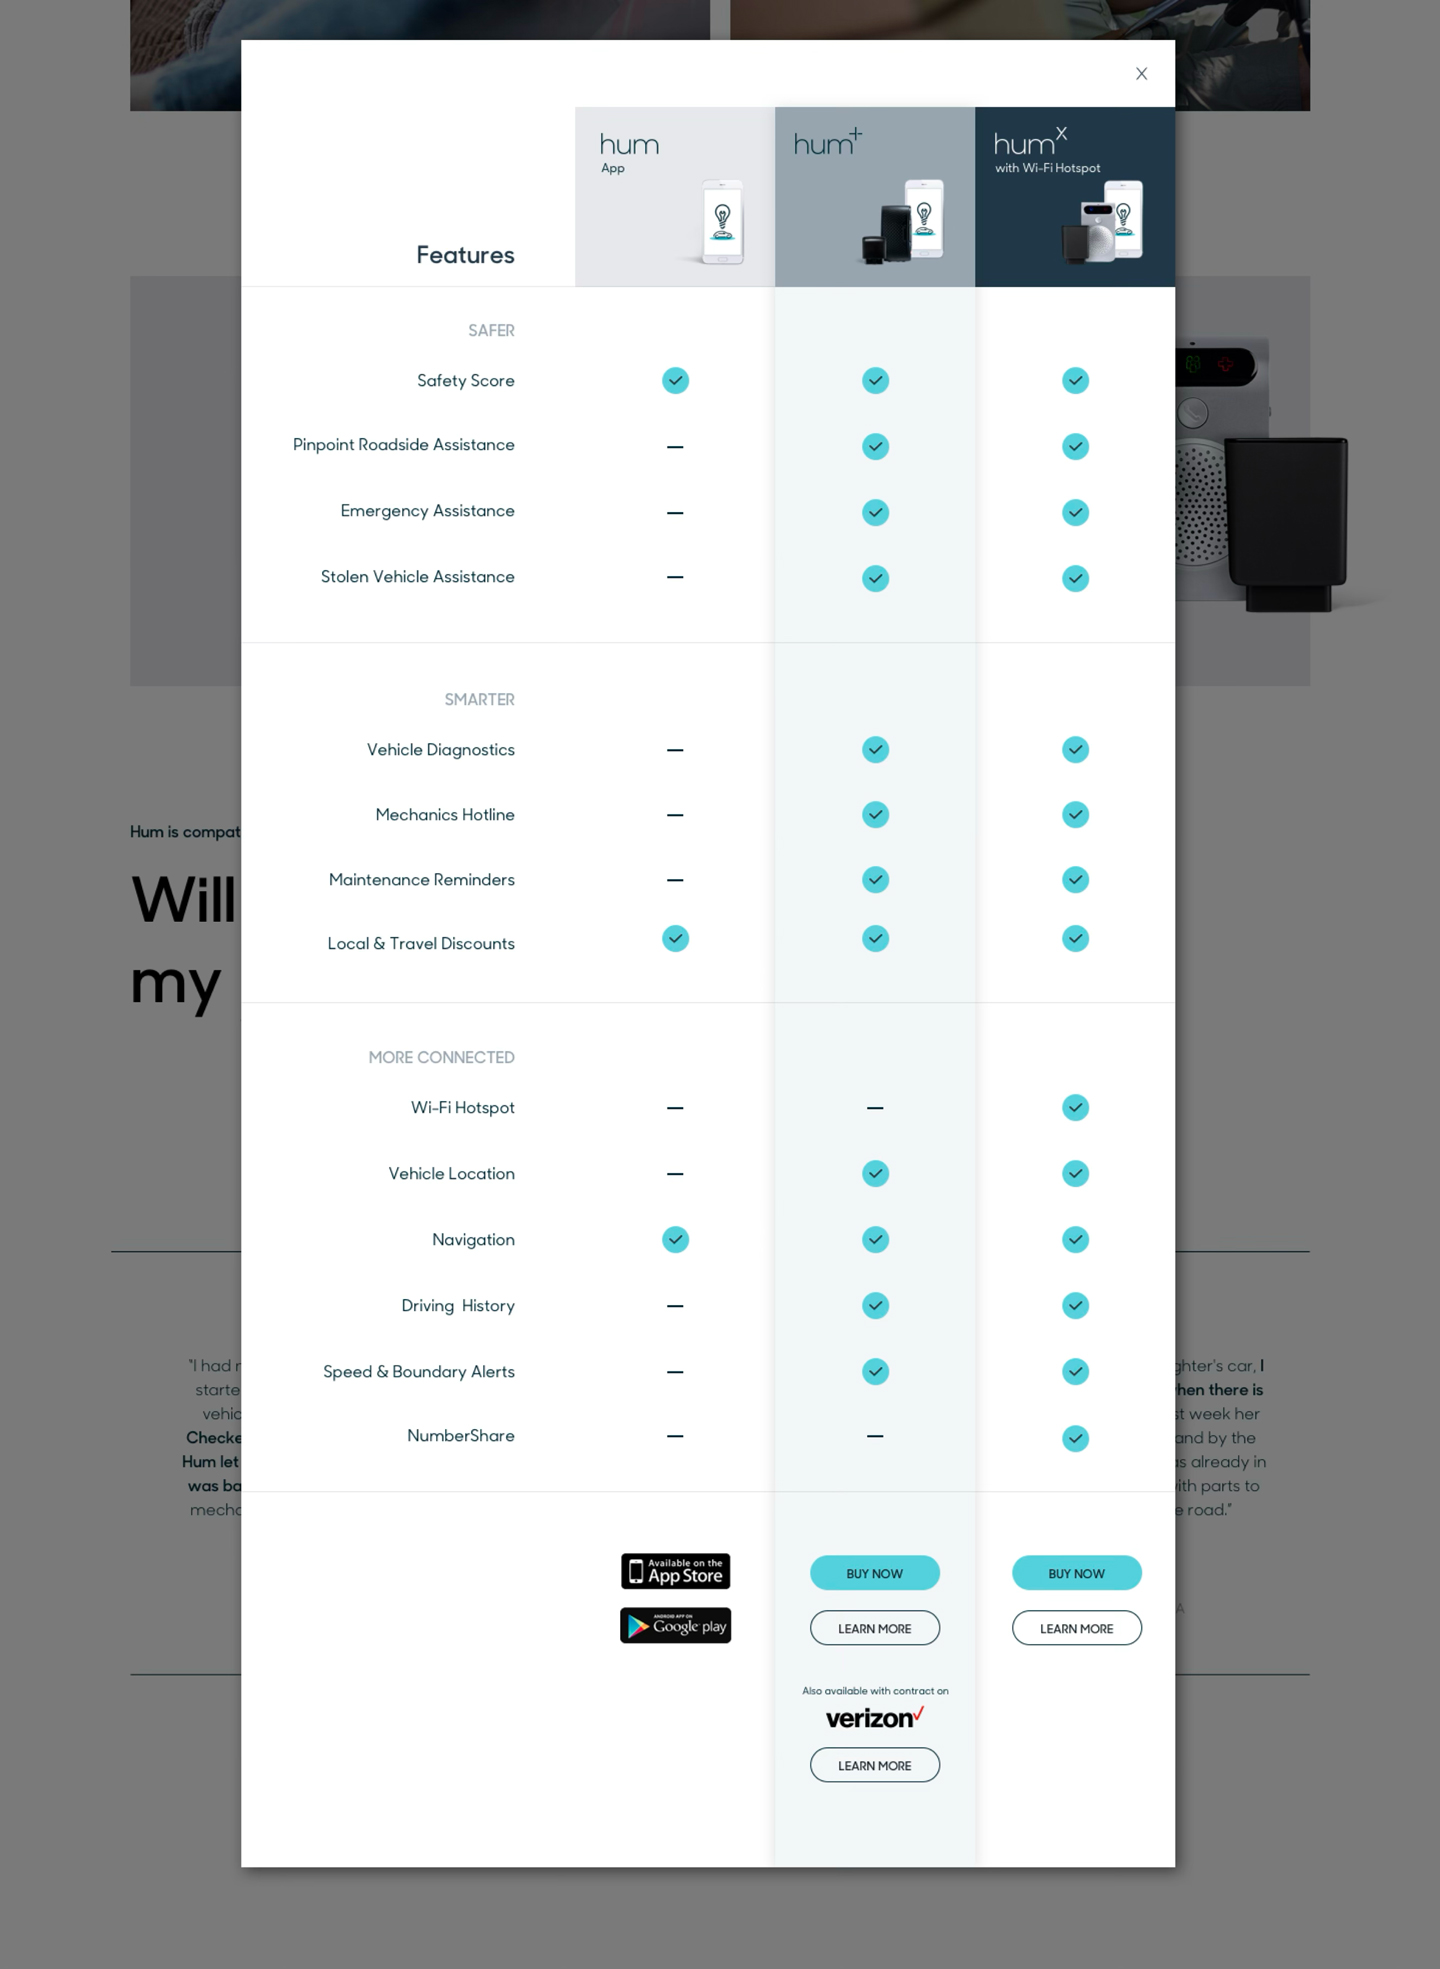
Organize information, eliminate confusion
Next, we needed to reign in the chaotic nature which the site’s content had been designed and written around, especially around pricing structure.
The outcome was to implement clear and simple storybuilding down the page and comparison tables for features and prices.
Add site intelligence
Finally, I proposed that we begin to augment the site experience when we were able to recognize customer’s who were returning.
While first-time visitors were oriented and educated to Hum, revisits were to begin leaning heavily on value proposition and use cases.
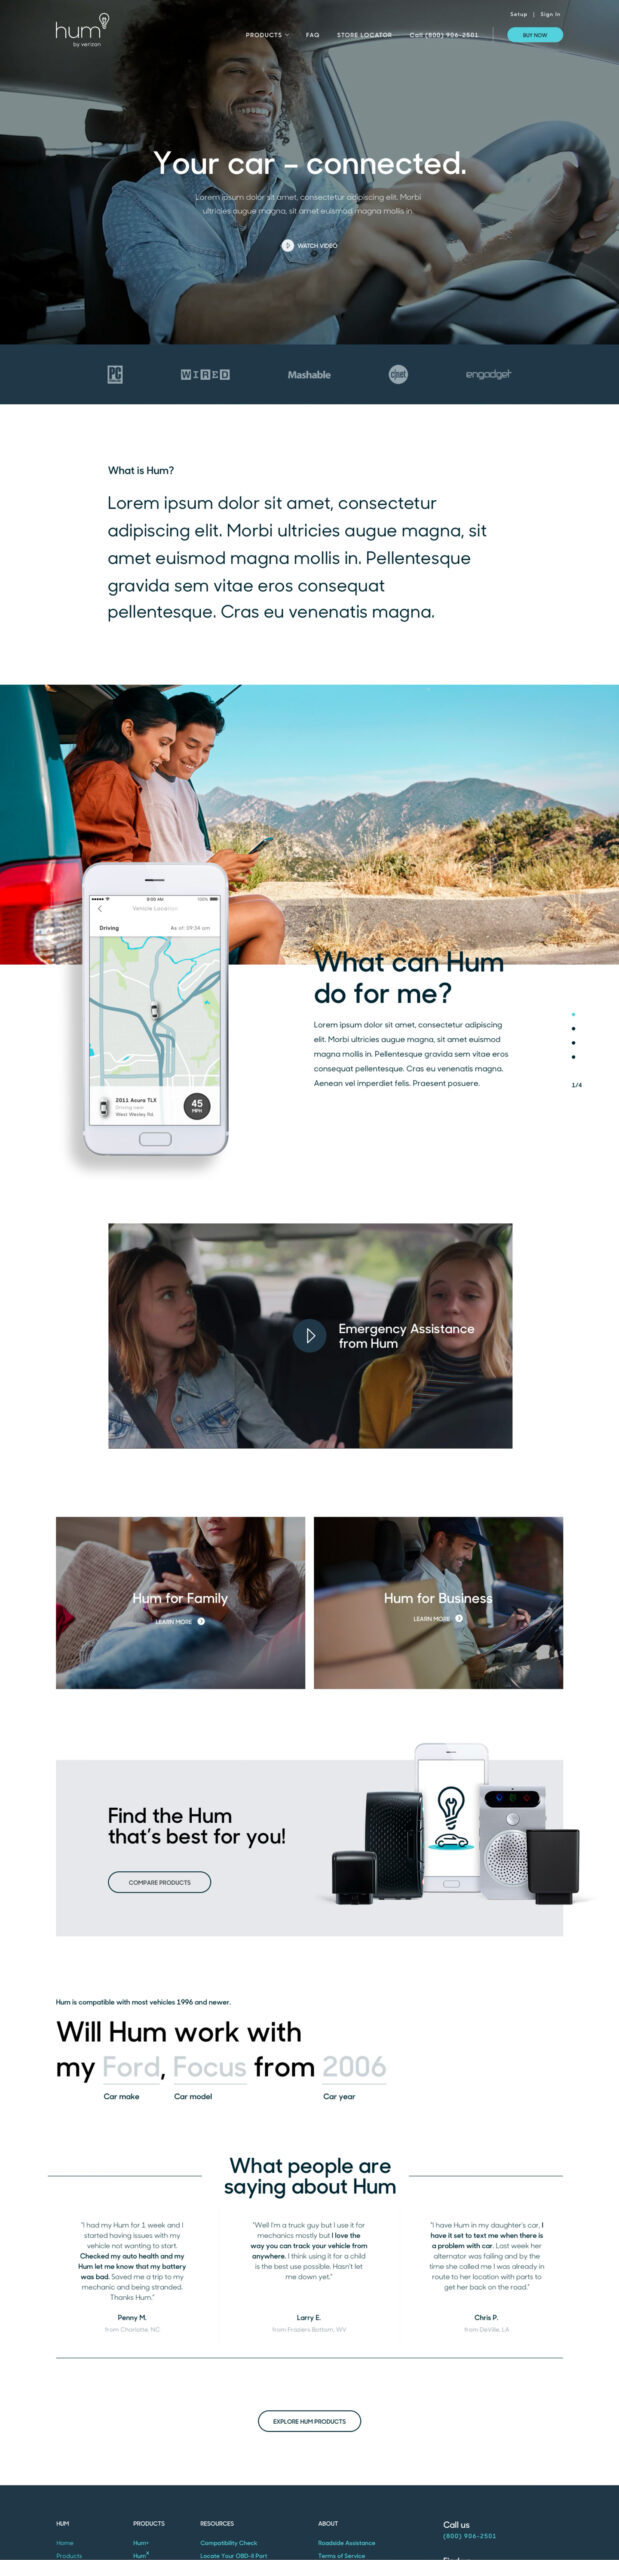
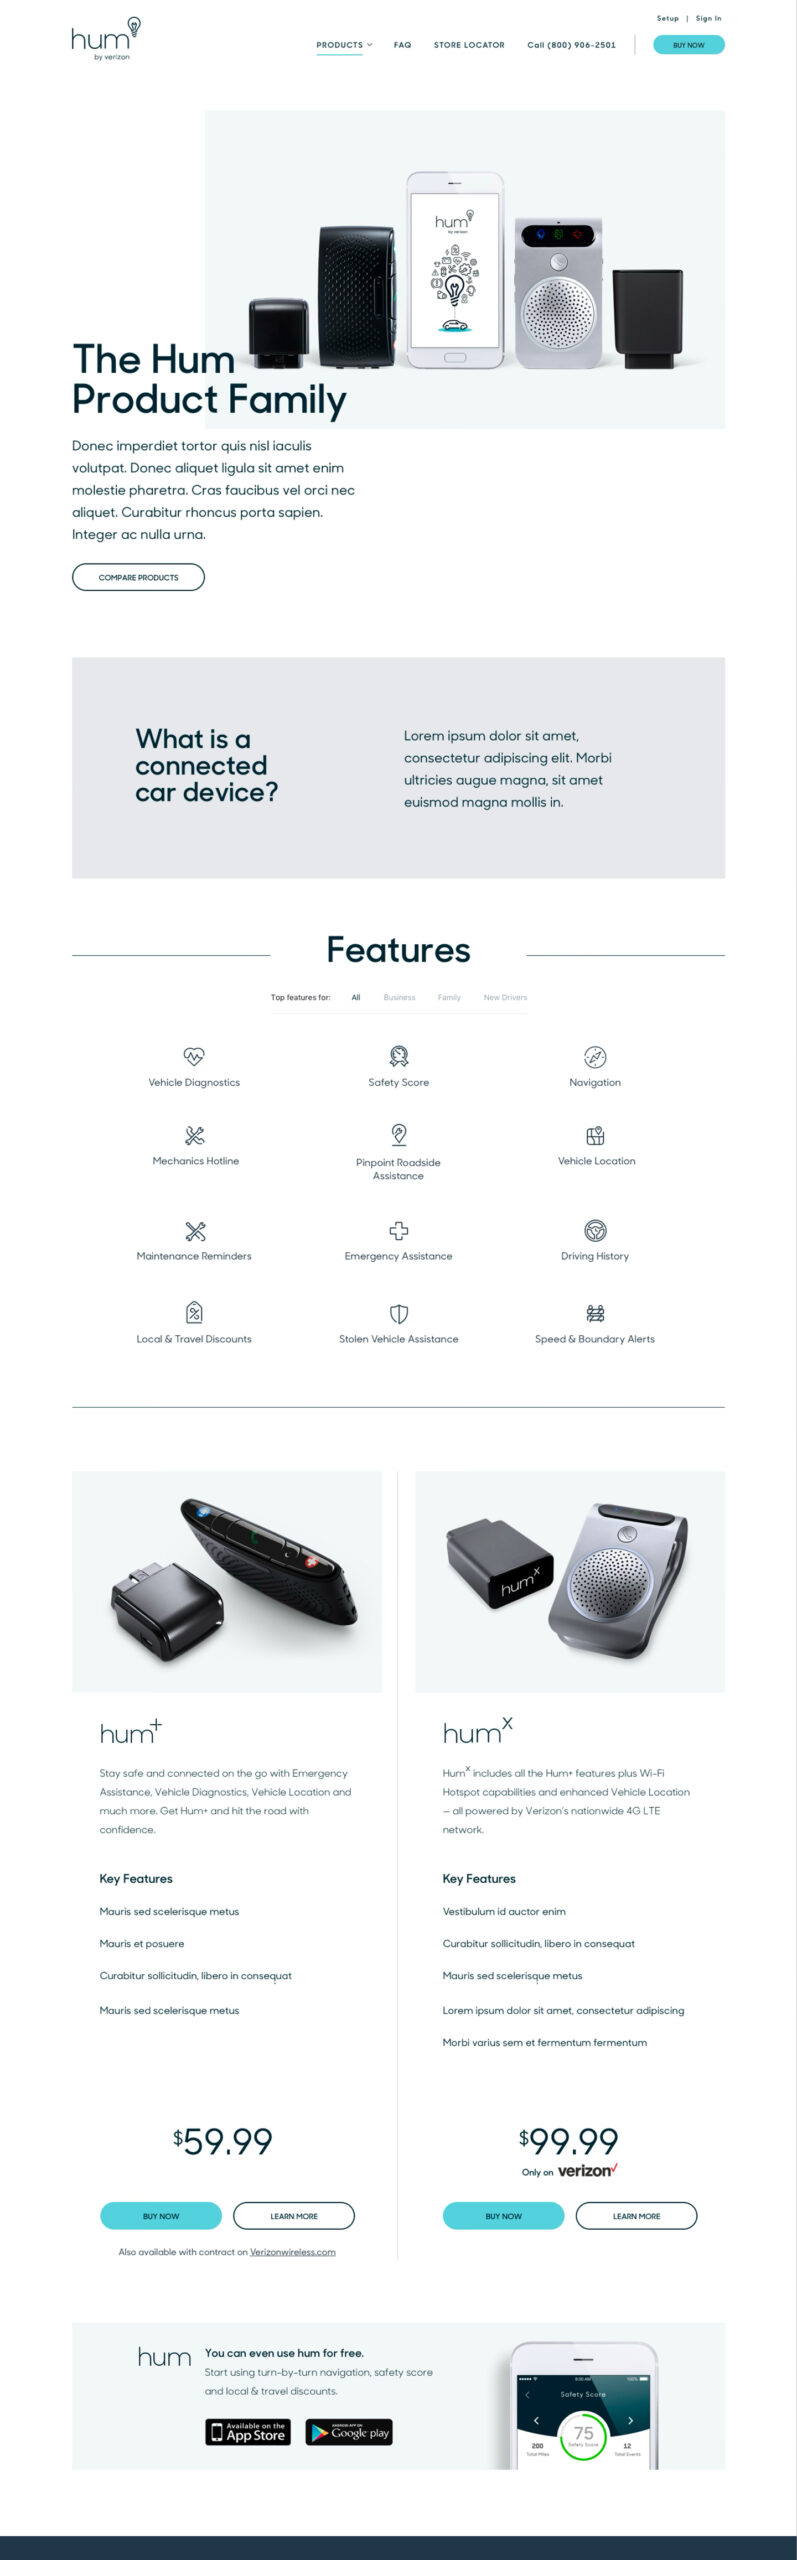
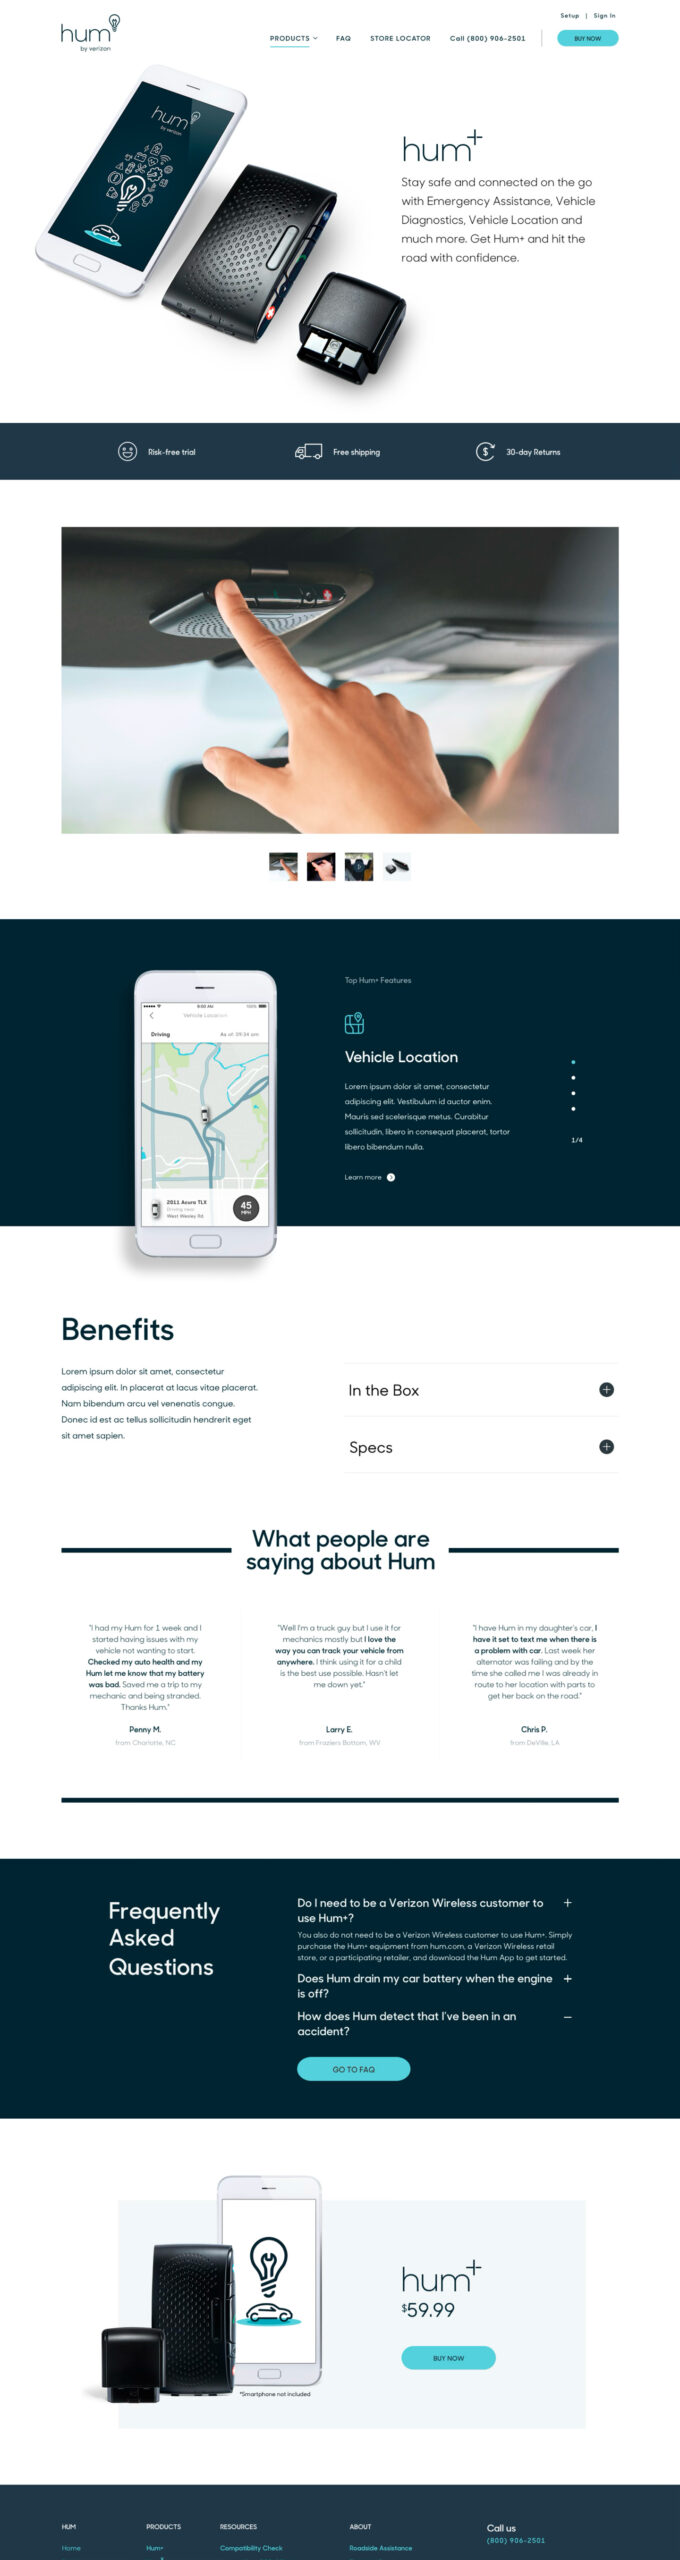
Below you can see proposed user flows and net new site elements that delivered on the solutions above:


The total process — from joining the team in January 2018 through solutions being launched to public — took 8 weeks. Post-launch of our updated solutions, I stayed on board the account for another 3 months, overseeing performance deltas and reinforcing our strategic solutions.
Once launched, the website saw immediate performance improvements:

Designs
Similar Projects

